Key takeaways
- Under 44 CFR 201.6(c)(2)(i), a local hazard mitigation plan's risk assessment must describe the type, location and extent of all natural hazards that can affect the jurisdiction, with previous occurrences and the probability of future events.
- NOAA's storm surge risk maps show the near worst-case surge at high tide for each hurricane category, built from tens of thousands of simulated hurricanes in each model area.
- NOAA says the maps are for general awareness at a city or community level, not for parcel-level assessment, permitting or replacing hurricane evacuation zones.
For the storm surge part of a hazard mitigation plan's risk assessment, EIKOS puts NOAA's storm surge risk maps and US Geological Survey high water marks from past floods on one map of the area you plan for. A planning team can see where hurricane surge could reach and how deep, see where some past floods actually reached, and save the view as a picture for a draft chapter or a public meeting.
That supports part of what 44 CFR 201.6(c)(2) asks of a local risk assessment for one hazard. This guide shows how to get it from EIKOS, using Warwick, Rhode Island, on Narragansett Bay as the example, and what to check before you put it in a plan. At Cambium AI, we built EIKOS for anyone whose work depends on understanding an area and the people who live there.
What does EIKOS show for storm surge?
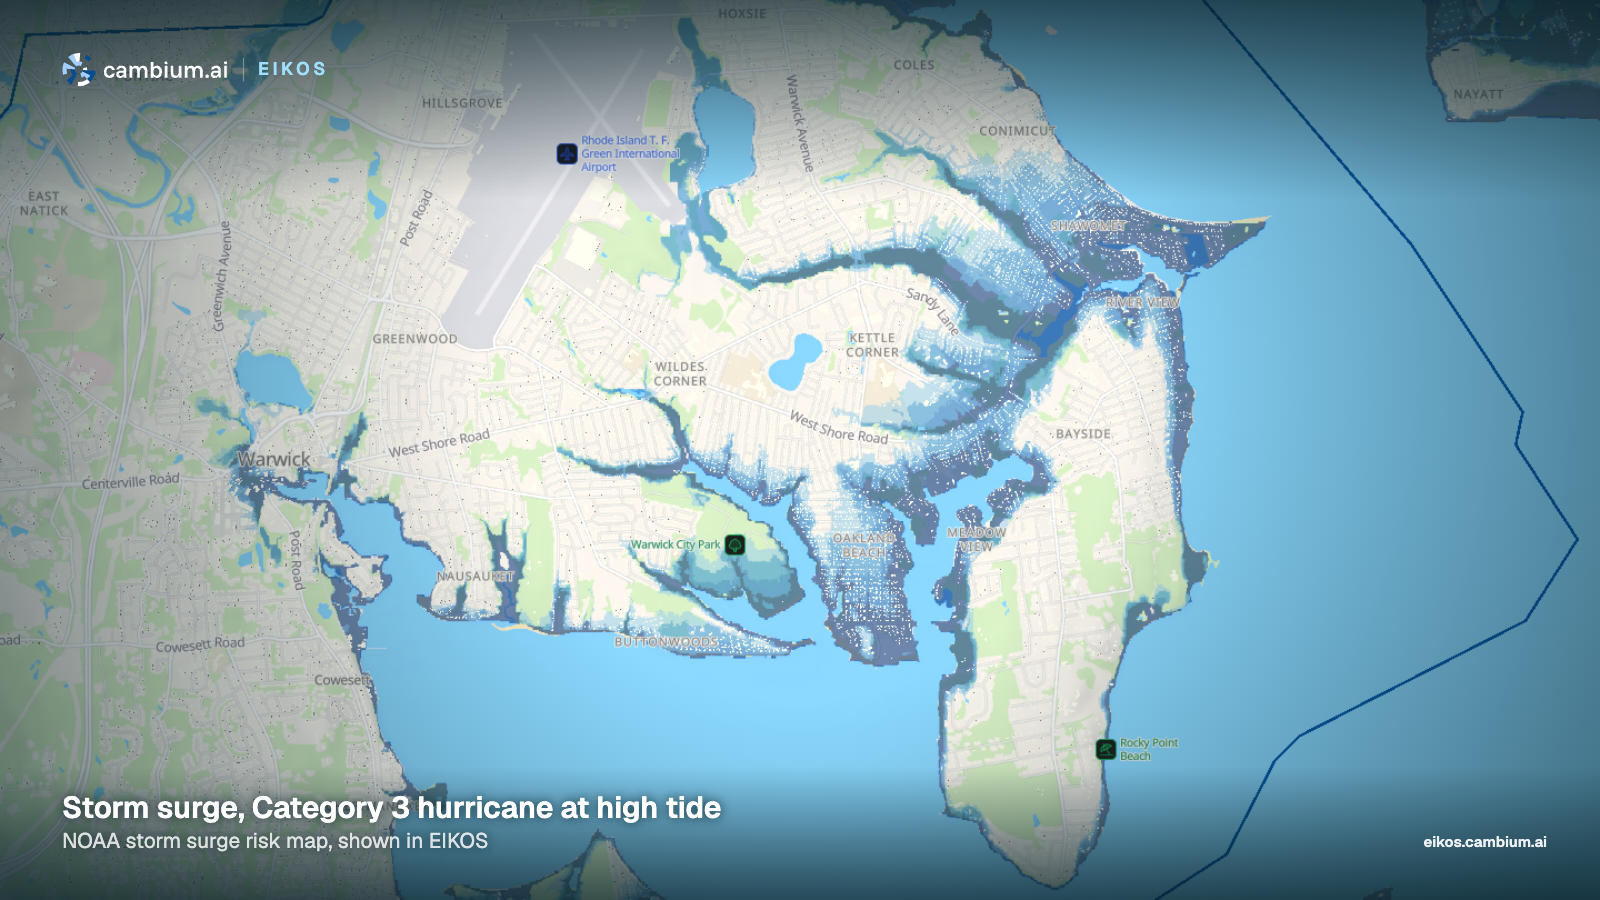
For hurricane categories 1 to 4, the Flood risk map in EIKOS shows NOAA's storm surge risk maps. NOAA's National Hurricane Center simulates tens of thousands of hypothetical hurricanes in each model area and keeps the highest water in each place, starting from high tide. NOAA calls the result the near worst-case scenario of flooding for each category. Each map combines many simulated storms, so no single hurricane would flood every area it shows.
EIKOS colors the water by how deep the surge could be above the ground, in four bands: up to 3 feet, 3 to 6 feet, 6 to 9 feet and over 9 feet. Areas behind levees appear in gray and are labeled Leveed area, not mapped, because NOAA's data gives no surge depth for them.
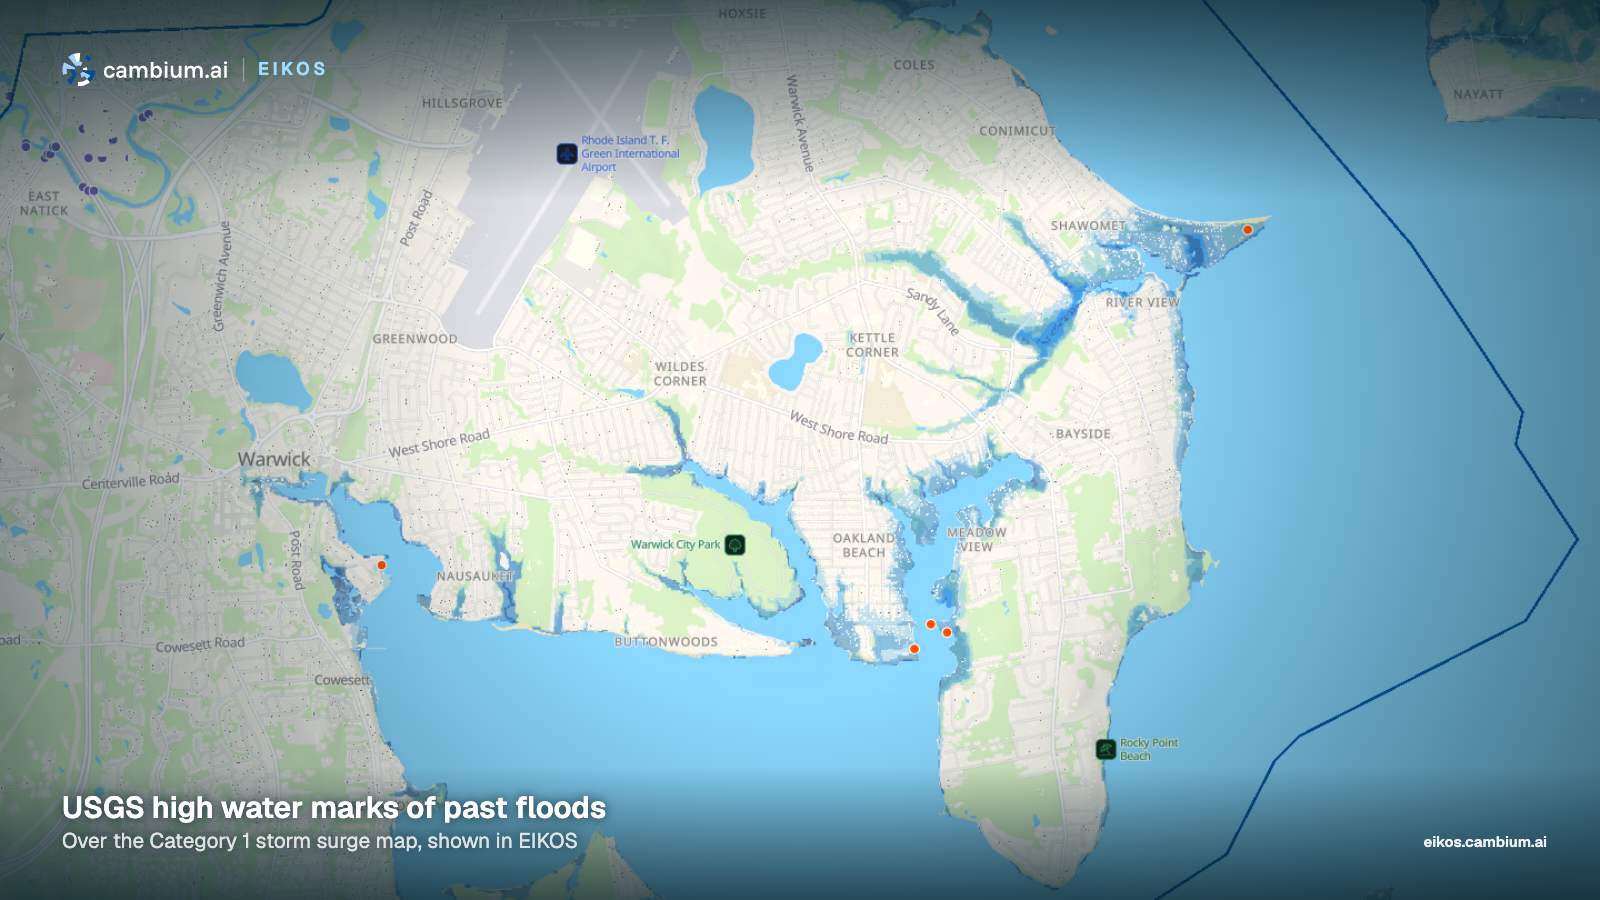
For previous occurrences, EIKOS adds high water marks from the US Geological Survey. Coastal flood marks are orange and river flood marks are purple. Each mark's card names the flood, or gives its date, and gives the water level at that spot as an elevation above the vertical datum the card names, a depth above the ground, or both. The marks show where some past floods actually reached. They are a record of past events.
How to map storm surge for your area in EIKOS
- Open the coastal area you plan for in EIKOS, if it is one EIKOS covers.
- Open the Disruptions tab and choose Flooding.
- Select Flood risk, then pick a number from 1 to 4 under Hurricane category. Those four are NOAA's maps, so use them for a plan. Start with Category 1 and step up, so you can see how much further each category reaches over the same streets.
- Check High water marks to add the marks from past floods, and select a mark to open its card.
- Select the Share this view button on the map and choose Make a picture. Pick a format, then Download to save a PNG. The Place, time and figures checkbox is on by default and adds the place, the time and the simulated figures for the area. For a plan figure, uncheck it, so the simulated figures are not read as a count of people in the flood area.
Comparing categories is often the useful part. In Warwick, Category 1 water stays close to the shore and the coves, and Category 3 water reaches well inland along the inlets, as the two pictures above show. That kind of side-by-side view helps a team see which neighborhoods to look at more closely, and explain the choice at a public meeting.
Where it fits in the risk assessment
Under 44 CFR 201.6(c)(2)(i), the risk assessment describes the type, location and extent of all natural hazards that can affect the jurisdiction, with information on previous occurrences and on the probability of future events. For hurricane storm surge, the Flood risk map shows where water could reach and how deep it could get in each category. The high water marks add part of the record of previous occurrences. Marks exist only for floods where they were collected, so local records, past studies and the existing plan fill in the rest, including older storms.
The map does not speak to probability. It shows a near worst case for each category, not how likely that is, so that part of the section needs other sources. In a plan that covers several jurisdictions, the rule also asks the risk assessment to show where each one's risks differ from the planning area as a whole.
Vulnerability comes next. Under 44 CFR 201.6(c)(2)(ii), the plan must include an overall summary of each hazard and its impact on the community, and it must address National Flood Insurance Program insured structures that floods have damaged repeatedly. It should describe the types and numbers of existing and future buildings, infrastructure and critical facilities in hazard areas, estimated dollar losses and how they were estimated, and land uses and development trends. Those need other sources, such as local parcel and facility data and your state hazard mitigation office.
EIKOS can add the people side for the area as a whole. Its simulation estimates how many people are in an area through an ordinary day, hour by hour, counting residents and simulated people who come in from other places. Its figures cover the whole area, including places outside the flood zone. It is a model of a normal day, not a count, and not a day with an evacuation, so if you use it in a plan, describe it as an estimate and name the method. To check daytime population against an official figure, our guide on how to calculate daytime population for an area shows the Census Bureau's own method for the working day.
Each area in EIKOS also has a planning report, with sections on topics such as population, housing and employment, which names its sources and cites the state planning law that applies. That keeps the comprehensive plan's numbers next to the flood map when the team works on how the two plans connect. For more on that side of the work, see EIKOS for planning.
What to check before you rely on it
- NOAA's maps model surge from hurricanes only, by category. Coastal flooding from nor'easters and from storms below hurricane strength, flooding from heavy rain and rivers, and other hazards need their own sources.
- Hurricane categories are a wind scale. NOAA says the Saffir-Simpson scale is based only on a hurricane's maximum sustained wind speed and does not take storm surge into account, and that hurricanes of all categories can produce deadly storm surge.
- NOAA notes that surge could reach beyond the areas its maps show, because each map is limited to the area its model covers. A place with no shading is not necessarily safe.
- NOAA says its storm surge maps do not account for erosion, subsidence, sea-level change or future construction. They are for general education and awareness at a city or community level, not for parcel-level assessment, permitting, legal or regulatory purposes. Future sea level needs its own source.
- NOAA's maps should not replace hurricane evacuation zones, which local and state officials draw using more information. NOAA urges users to consult local officials about flood risk inside leveed areas, which the maps mark without a surge depth.
- NOAA says its maps for Puerto Rico, the US Virgin Islands, Hawaii, Guam and American Samoa account for wave setup, a rise in water level from breaking waves. Its description of that work does not include the Atlantic coast. The surge map is also not a flood insurance map, so floodplain and National Flood Insurance Program work will need FEMA's flood maps.
- Before comparing a high water mark with the surge map, check whether it is a coastal or river mark and whether it gives an elevation or a depth. A place with no marks may still have flooded.
- The people in EIKOS are simulated. The map shows an ordinary day for an area's residents and for people who come in from other places. It is not a count of people or a forecast of where people will be during a storm.
Warwick sits in Kent County, which has its own county page with population, income and housing figures. For how the product started, read why we built EIKOS. Cambium AI builds synthetic personas from verified public data. EIKOS is a simulation that shows an ordinary day in each area it covers, with a planning report for each one. To see it for the area you plan for, request a demo.
Sources: Code of Federal Regulations, 44 CFR 201.6, Local Mitigation Plans (eCFR, current as of November 16, 2026); NOAA National Hurricane Center, National Storm Surge Risk Maps, Version 4; NOAA National Hurricane Center, Saffir-Simpson Hurricane Wind Scale; US Geological Survey, high water marks of past floods, as shown in EIKOS.