
Key takeaways
- Daytime population is an estimate of how many people are in an area during normal business hours; the Census Bureau's method adds the workers who work there to the residents and subtracts the workers who live there.
- In a 2023 analysis, the Census Bureau found that Manhattan's commuter-adjusted population fell by about 800,000 between 2019 and 2021, while its resident population fell by roughly 50,000.
- The Census Bureau says its measure does not account for students, customers, tourists and other transient visitors, or for day-to-day differences in workers' schedules.
To calculate daytime population for an area, take the people who live there, add the workers who work there, and subtract the workers who live there. That is the Census Bureau's method, and it calls the result "commuter-adjusted population": an estimate of how many people are in an area during the working day, as opposed to the residents, who the Bureau assumes are there in the evening and at night. All three numbers come from American Community Survey tables. In a job center, the daytime number can be much larger than the resident one. In a place where more workers leave for jobs elsewhere than come in, it can be smaller.
Many services have to serve the people in a place during the day. Emergency response, transit, parking, water and sewer, and the lunchtime crowd on a main street all depend on who is there at noon, as well as on who lives there. That is a big part of why we built EIKOS at Cambium AI: to show how an area's population moves through an ordinary day, hour by hour, next to the published numbers planners already use.
This guide walks through the calculation step by step, what the figures can show, what they leave out, and how to look at an area's day in EIKOS, using downtown Boston as the example.
How do you calculate daytime population?
The Census Bureau's guidance on calculating commuter-adjusted population defines it as "the number of people who are assumed to be present in an area during normal business hours, including workers." It contrasts that with the resident population, the people "assumed to be present during the evening and nighttime hours."
The simplest method, in the Bureau's words, is: "Commuter-adjusted population = Total resident population + Total workers working in area - Total workers living in area." All three parts come from the American Community Survey, the Census Bureau's ongoing survey that asks people where they work. The Bureau has published ready-made commuter-adjusted estimates in the past, but for current data you calculate the figure yourself from three tables. The Bureau names the tables to use:
- People who live in the area: table B01003, Total Population.
- People who work in the area: table B08604, Total Workers for Workplace Geography.
- Workers who live in the area: the "Total:" line of table B08301, Means of Transportation to Work.
Add the first two and subtract the third. The tables are on data.census.gov, but not for every kind of area. The workplace table is published for states, counties, places, metro and micro areas, and a few other area types, and for county subdivisions only in Connecticut, Maine, Massachusetts, Michigan, Minnesota, New Hampshire, New Jersey, New York, Pennsylvania, Rhode Island, Vermont and Wisconsin. The Bureau also notes that the tables "may not be published for some areas" because of reliability and privacy rules. Each table is a survey estimate with its own margin of error, so treat a small area's figure as a range, not a single number. The workplace table is not published for census tracts, so this method stops at the area types listed above, plus county parts within places.
Pick the right estimates too. The Census Bureau's guide to ACS estimates shows that standard 1-year estimates cover areas with populations of 65,000 or more, while 5-year estimates cover all areas. For these three tables, areas under 65,000 people need 5-year estimates, which pool five years of responses. Use the same release for all three tables, such as the 2020-2024 5-year estimates. That release includes 2020 and 2021, early in the pandemic, so check it against 1-year estimates where your county has them.
A worked example: Boston
Here is the calculation for the city of Boston, using the Census Bureau's 2020-2024 American Community Survey 5-year estimates from data.census.gov. The sum is Cambium AI's; the three figures are the Bureau's.
- People who live in Boston (table B01003): 666,442, with a margin of error of plus or minus 55.
- Workers who work in Boston (table B08604): 617,937, plus or minus 5,608.
- Workers who live in Boston (table B08301, the "Total:" line): 368,226, plus or minus 2,667.
666,442 plus 617,937, minus 368,226, gives a daytime population of about 916,000. On that estimate, Boston holds roughly 250,000 more people during the working day than live there, a little over a third more. Because each part has a margin of error, read the result as a range of several thousand either side, not an exact count.
What can daytime population show?
The clearest recent example is the Census Bureau's own. In a 2023 story, Growth in Home-Based Work Decreased Manhattan's Commuter-Adjusted Population by 800,000, it compared 2019 and 2021 American Community Survey 1-year estimates to see how working from home changed where people spent the workday.
In Manhattan, the resident population fell by roughly 50,000, but the commuter-adjusted population fell by about 800,000. Brooklyn moved the other way: its resident population grew by roughly 81,000 and its commuter-adjusted population by about 300,000. In Cook County, Illinois, the commuter-adjusted population fell by about 60,000 even though the county gained about 23,000 residents.
Those figures compare 2019 with 2021, early in the shift to working from home. The share of workers who worked from home is still changing: the Census Bureau's latest 1-year commuting release puts it at 12.9 percent in 2025, down from 13.3 percent in 2024. So check the latest estimates for your own area before you rely on an older comparison.
The lesson for planning is that the resident count alone can miss large shifts in who is in a place during the day. A downtown can lose a big share of its weekday crowd while its resident numbers barely move, and that changes the demand for transit, lunch trade and parking.
What does the Census measure leave out?
The Census Bureau is direct about the limits. In its 2023 story on Manhattan, it says the commuter-adjusted population "is not a complete measure of how an area's population may change during a typical working day. It does not account for students, customers, tourists and other transient visitors or for day-to-day differences in workers' schedules."
Three more things follow from how it is built. It is one number for normal business hours, so it says nothing about evenings, nights or weekends. It counts where people worked during the survey's reference week, the place the Census Bureau's commuting FAQ describes as where they "carried out their occupational activities during the reference week," not where they are at a given hour. And it comes from survey estimates, which come with margins of error.
So the Census figure is a sound starting point for the size of the workday population, and planners need other evidence to see how that population moves through the day.
How to see an area's day in EIKOS
We built EIKOS to help with part of that gap: the time of day, and residents' trips to school, shops and other places as well as work. Like the Census measure, it does not include tourists and other visitors. When we spoke with planners while building it, many told us the information exists, but getting it together takes time. EIKOS shows a simulation of an ordinary day in each area it covers. Each simulated resident has a home in a real building and a daily routine from a time-use diary, so you can see where the model places people at 3 AM, at noon and in the evening. Here is how to look at it.
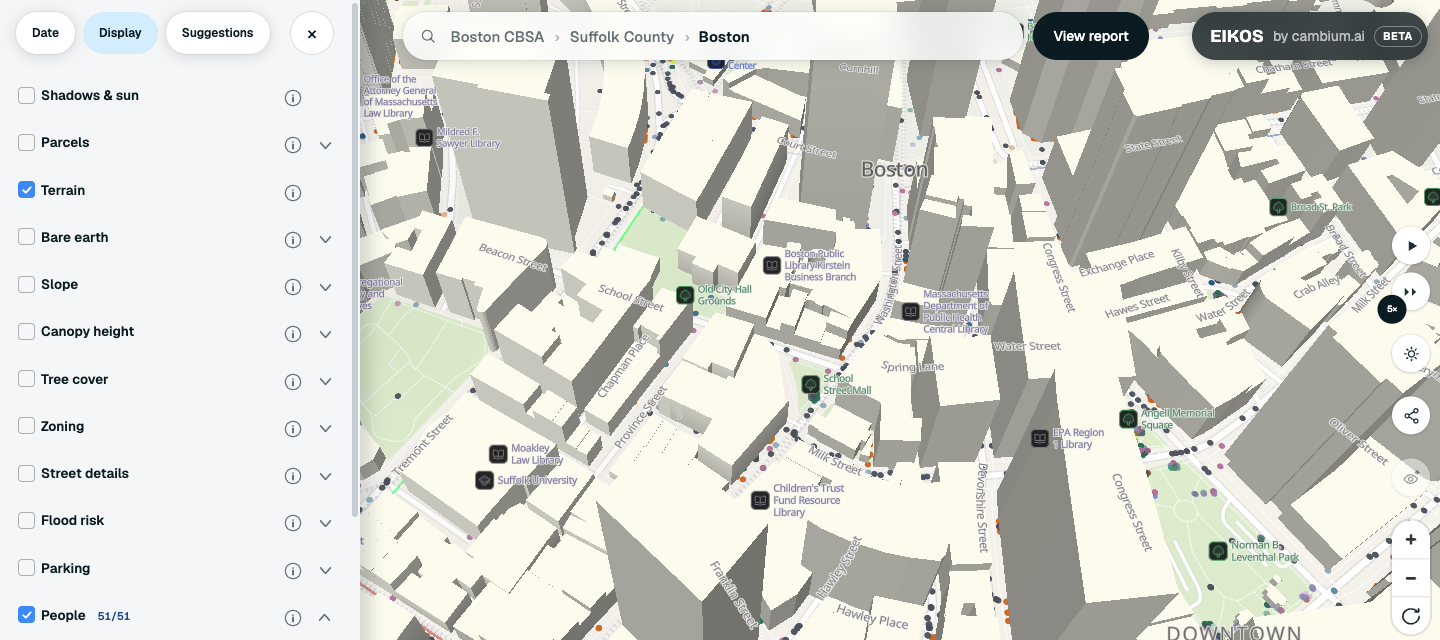
- Open the area. Search for it in the search bar. The path in the search bar lets you move between scales, for example from Boston up to Suffolk County and the Boston CBSA, its metro region.
- Pick the day and time. In the Date tab, the date sets the day type, such as a weekday, Saturday or Sunday, and the Time of day slider moves through the day. Jump to 8am takes you to 8 AM today, and Back to now returns to the current time.
- Check that People is on. In the Display tab, People shows the simulated residents, one dot per person. It is on when you open EIKOS. Zoomed out you see a sample; zoom in to see everyone in view. The activity list lets you narrow the dots to what people are doing, such as work or education. Use Deselect all, then tick the activities you want.
- Compare the hours. Set the time to 3 AM, then to noon. The change between the two hours is the simulation's picture of how the area's population shifts during the day. It is not the Census commuter-adjusted estimate.
- Make a picture. Click the share button on the map to open the Share this view card. Make a picture opens a picture of the view. Leave Place, time and figures ticked to add the place, the time and the simulation's figures under the label "A simulated day in", then choose Download or Copy image.
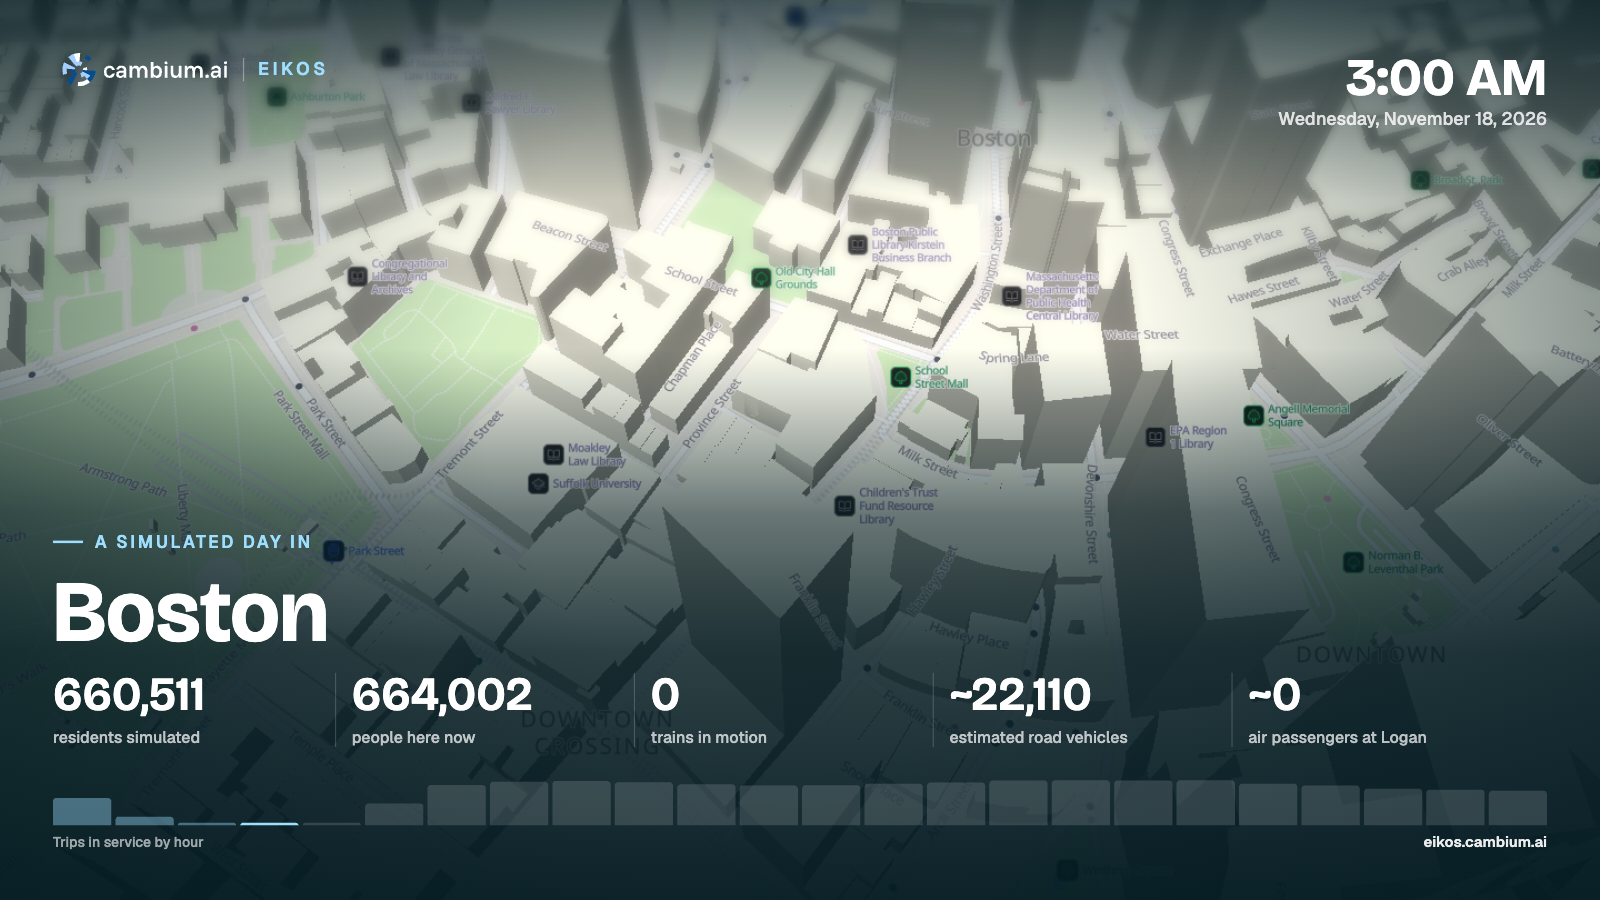
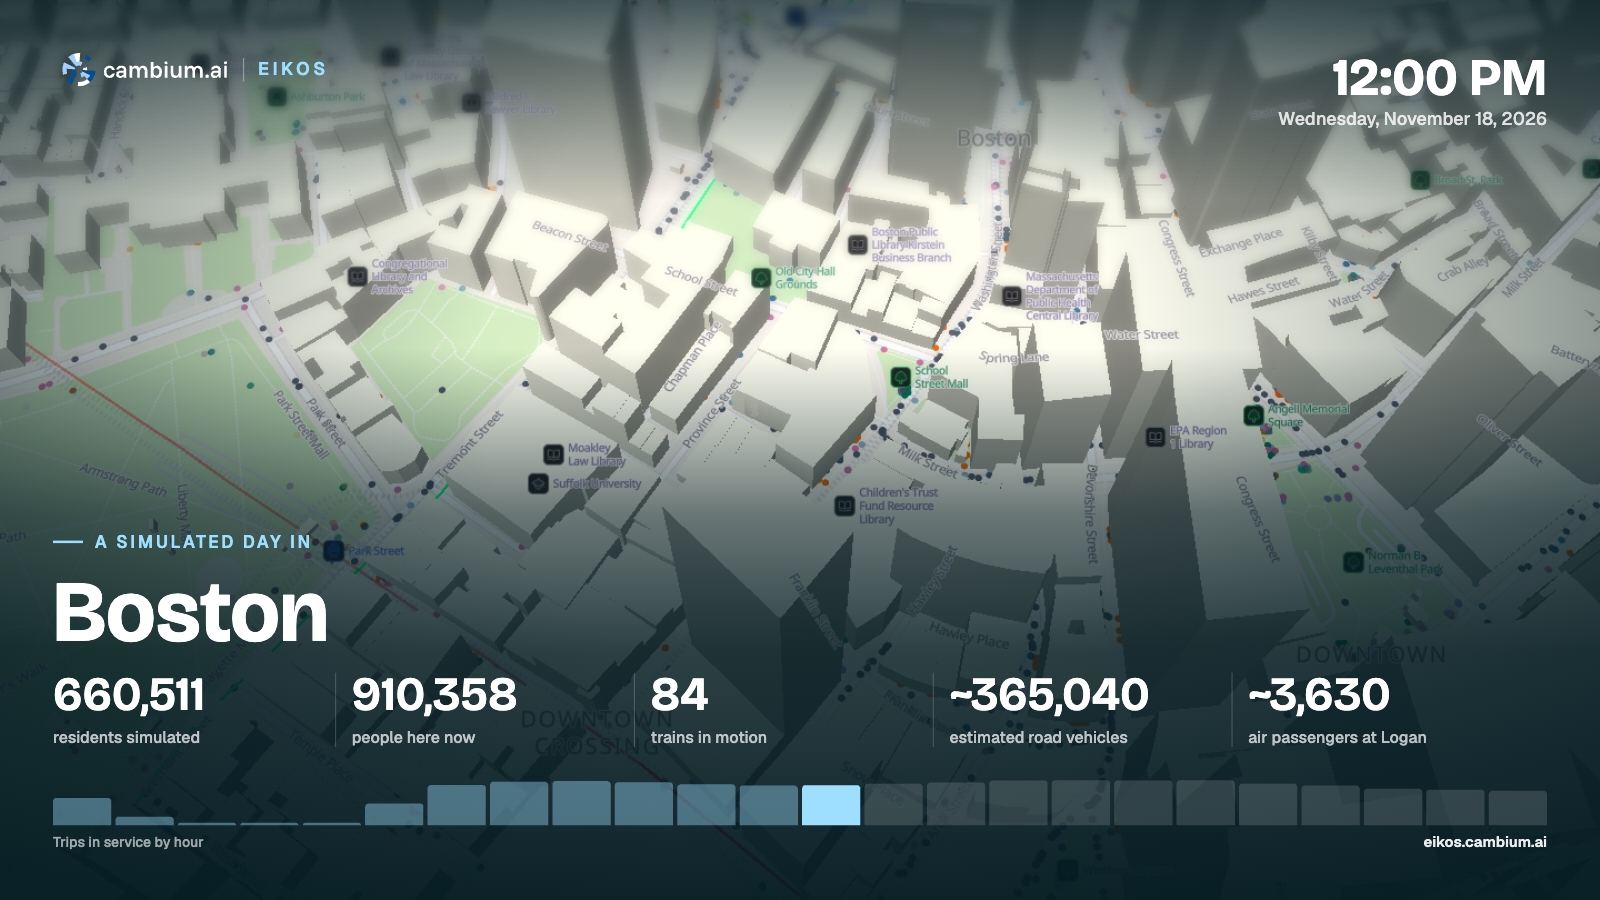
The two pictures show the same downtown streets at 3 AM and at noon. The figures under them are for the whole city of Boston, labeled as a simulated day. On those pictures, people here now counts everyone the simulation places in the area at that hour, including people who live elsewhere and come in, which is why it can be higher than residents simulated. In Boston, the simulation lines up with the Census figures in the worked example above: its residents and its noon count are both within 1 percent of them. The two may not match exactly in every area, because the Census sum assumes every worker is at their workplace while EIKOS places people hour by hour, and EIKOS leaves out tourists and other visitors. What the simulation adds is the rest of the day: how that daytime number rises and falls, and where in the area people are.
What to check before you rely on it
- The simulation is a model of an ordinary day, not a headcount. Check it against the Census figure for your area, as in the Boston example, before you quote a number from it.
- People in EIKOS are simulated residents, so the count in an area at a given hour includes residents who live elsewhere and come in. Air passengers at the main airport are modeled separately, and tourists and other visitors are not part of People.
- In EIKOS, people travel in straight lines between home, work and school, so a dot can cross a river. Other trips go to a real place when a source names one.
- For the Census estimate, check each table's margin of error, and use the same release for all three tables.
Boston sits in Suffolk County, which has its own county page with population, income and housing figures. Cambium AI builds synthetic personas from verified public data. EIKOS is a simulation that shows an ordinary day in each area it covers, with a planning report for each one. To see it for the area you plan for, request a demo.
Sources: US Census Bureau, Calculating Commuter-Adjusted Population Estimates (page last revised April 18, 2023); US Census Bureau, Growth in Home-Based Work Decreased Manhattan's Commuter-Adjusted Population by 800,000 (July 2023), using American Community Survey 1-year estimates for 2019 and 2021; US Census Bureau, Using 1-Year or 5-Year American Community Survey Data; US Census Bureau, United States Commuting at a Glance, ACS 1-year estimates for 2025 (page last revised October 26, 2026); US Census Bureau, Frequently Asked Questions (FAQs) about Commuting; US Census Bureau, American Community Survey 2020-2024 5-year estimates, tables B01003, B08604 and B08301, Boston city, Massachusetts (data.census.gov).